
Capturing Nonlinear Value Factor Strategy Using AI ETF

In our view, traditional asset managers have long sought to create excess returns with linear value factor strategies. Many of these conventional value factor strategies apply linear functions[1] using valuation ratios such as P/E[2], P/B[3], and EV/CFO[4].
However, we find two drawbacks of such an approach – 1) intangible assets tend to be under-appreciated in the traditional P/B ratio, and 2) a linear function may not be fully optimized to measure the relative cheapness of stock prices.
According to a study conducted by Aon[5], in 2018, S&P 500 firms had intangible assets valued nominally at $21.03 trillion versus tangible assets of $4 trillion.
Moreover, a poll conducted by investment firm Columbus Threadneedle found that 88% of investors answered with the response 'Agree or Strongly Agree' when asked if "Conventional valuation methods such as discounted cash flow are inadequate without thorough consideration of intangible assets"[6], further highlighting the importance of measuring intangibles.
With the increasing value of intangible assets held by S&P 500 firms, asset managers may turn their eyes to unconventional solutions that can capture a company's intrinsic value, applying nonlinear functions[7] by artificial intelligence. In short, an alternative or complementary approach may be of value.

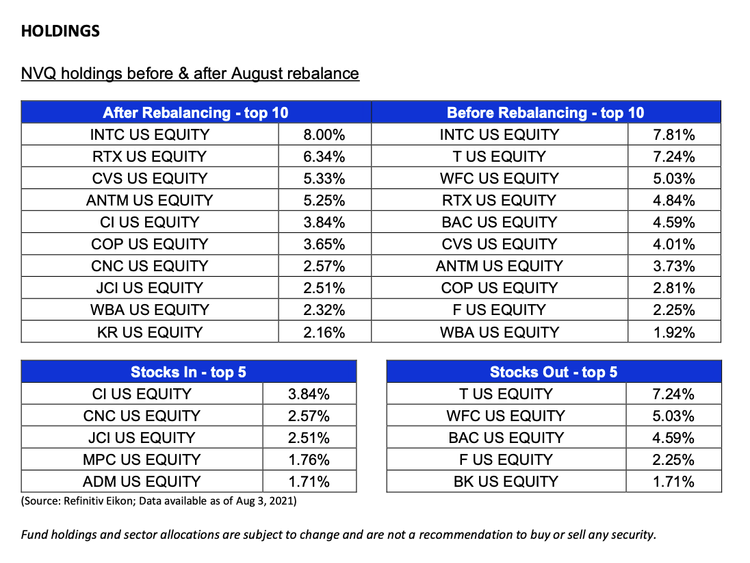
Qraft provides that approach, as exemplified by its AI ETF, NVQ. The Qraft AI-Enhanced U.S. Next Value ETF (NYSE: NVQ) has shown so far that Qraft’s technology can calculate the P/B ratio more accurately by including intangible assets value based on R&D costs, marketing costs, patent issuance, etc. After reassessing the P/B ratio, Qraft AI finds a nonlinear function that seeks to build an optimized value stock portfolio every month.
It can be time-consuming and costly to create a nonlinear function of multiple variables via human’s numerous trials and errors. With deep learning techniques, we believe Qraft AI can continuously adapt to a rapidly changing market and search for the best-optimized strategy.
Human managers, however, do not have to feel as if AI is replacing them, as nonlinear and linear (or conventional) value factor strategies can be complementary. A portfolio utilizing both linear and nonlinear methods could be a balanced approach to value investing.
NVQ has been showing attractive performances since its inception on 12/02/20.

[1] Linear function: a function that describes a straight-line relationship between two variables
[2] P/E: Price to earnings ratio, values a company by measuring its current share price to its per-share earnings (EPS)
[3] P/B: Price to book ratio, compares a company’s current market value to its book value
[4] E/V: Enterprise value, measures the market value of a firm using sum of claims of both creditors and shareholders
[5] Intangible Assets Strategy, Capital Markets and Risk Management. (2020). AON. https://www.aon.com/thought-leadership/ponemoninstitutereport.jsp
[6] “Grasping The Intangible: How Intangible Assets Reveal Latent Value.” Columbia Threadneedle Investments, https://www.columbiathreadneedleus.com/binaries/content/assets/cti-blog/intangible_assets_t_logo.pdf
[7] Nonlinear function: a function where there is no straight-line or direct relationship between independent and dependent variables. In a nonlinear function, changes in output do not change in direct proportion to changes in any of the inputs